Genesis
In the beginning there was the Poisson-Boltzmann equation. Solving it for the case of a salt solution in contact with a negatively charged plane surface (a.k.a. the Gouy-Chapman model) gives the concentration of cations and anions in the solution as a function of the distance to the surface, like this1

Note:
- The suppression of the anion concentration near the surface is often referred to as negative adsorption or anion exclusion. The total amount of excluded anions per unit surface area (indicated in green), usually labeled \(\Gamma^-\), is obtained by integrating the Poisson-Boltzmann equation.
- There are, nevertheless, anions everywhere! This model will give zero anion concentration only for an infinitely negative electrostatic potential (or if \(c_0 = 0\), of course).
A clever way to utilize negative adsorption is for estimating the amount of smectite surface area in a soil sample, first suggested by Schofield (1947). This is done by comparing measured values of negative adsorption with the appropriate expression evaluated from the Gouy-Chapman model. When doing the necessary math2 for such an analysis you naturally end up with expressions like
\begin{equation} \frac{\Gamma^-}{c_0} \sim \text{const.}\cdot \kappa^{-1} \tag{1} \end{equation}
where \(c_0\) is the external anion concentration (i.e. far from the surface), and \(\kappa^{-1}\) is the Debye length. This equation, having the dimension of length, can be interpreted as the width, \(d_{ex}\), of a region devoid of anions, which gives the same amount of negative adsorption as the full exclusion region, as illustrated here (yellow)

However, note:
- This is just an equivalent, fictitious region.
- Anions are still everywhere!
Due to its convenience in the analysis, the notion of an equivalent region devoid of anions — often referred to in terms of “volume of exclusion” — became rather popular. At the same time, authors stopped emphasizing that this is a fictitious region. A clear example of such a transition is Edwards and Quirk (1962) who states that \(\Gamma^-/c_0\) “can be regarded as the surface depth from which chloride ions are excluded”, while in Edwards et al. (1965) the same quantity (multiplied by area) is referred to as “the volume from which chloride is excluded”. The latter statement is, strictly speaking, wrong: the actual volume from which anions are excluded is the entire region where the concentration deviates from \(c_0\), and the exclusion is only partial — there are anions everywhere!
Compacted bentonite
But the idea of an actual region devoid of anions seems to have stuck, and I believe that this influenced the interpretation of diffusion in compacted bentonite3 in terms of “effective porosity” or “anion accessible-porosity”. Concepts which, in turn, have motivated the idea that bentonite contains bulk water (“free water”, “pore water”).
The first example of this usage in studies of compacted bentonite, that I know of, is in Muurinen et al. (1988) reporting chloride through-diffusion in bentonite with various densities and background concentrations.
The tracer concentration of the porewater clearly depends on the compaction of bentonite and on the salt concentration of the circulating water. The effective porosity can even be less than one percent when the salt concentration is low and compaction high. Also, the diffusivities strongly depend on the density of bentonite and on the salt concentration.
The low tracer concentration in bentonite in the diffusion tests […] are indicative of ion-exclusion [5]. Ion-exclusion probably decreases the effective size of the pores, which changes the geometric factor, of bentonite and thus the apparent diffusivity. In addition to the geometric factor, the effective diffusivity takes into account the effective pore volume; thus, the dependence is even stronger.
“Effective porosity” has not been defined earlier in the article, so it is difficult to know precisely what the authors mean by the term. But it is relatively clear4 from the second paragraph that they explain the measured fluxes as being a result of a physical variation of the pore volume accessible to anions, rather than as a variation of the tracer concentration in a homogeneous system. This is also supported by their writing in the conclusions section: “The decreased pore size and porosity caused by ion-exclusion could at least qualitatively explain the dependence.”
However, the reference they provide (“[5]”) is Soudek et al. (1984), who calculate anion exclusion by means of — the Poisson-Boltzmann equation! (Which predicts anions everywhere.) In fact, Soudek et al. (1984) calculate what they term “Donnan exclusion” in a homogeneous model of “parallel, equally-spaced platelets”. Thus, the reference supplied by Muurinen et al. (1988) is in direct contradiction with their interpretation that the pore size and porosity is decreasing with the salt concentration.
Soudek et al. (1984) even provide an example of how the average chloride concentration between the platelets depends on the separation distance, when in equilibrium with an external solution of 10 mM, and write
Note the extremely strong rejection of the co-ion. At 50 w% clay (\(\sim 25\)Å plate separation) almost 90% of the anions are rejected.
which is completely in line with the observation of Muurinen et al. (1988) that “The effective porosity can even be less than one percent when the salt concentration is low and compaction high”, if only “effective porosity” is replaced by “concentration between the plates”.
It makes me a bit tired to discover that the record could have been set straight over 30 years ago regarding which pores anions can access. Instead the bentonite research community, for the most part, doubled down on the idea that anions only have accesses to parts of the pore volume, or that compacted bentonite contains a significant amount of bulk water.
An explicit description of interpreting “chloride through diffusion porosity” as a specific, limited part of the pore volume is given by Bradbury and Baeyens (2003)
In the interlayer spaces and regions where the individual montmorillonite stacks are in close proximity, double layer overlap will occur and anion exclusion effects will take place. Exclusion will probably be so large that it is highly unlikely that anions can move through these regions (Bolt and de Haan, 1982). However, Cl anions do move relatively readily through compacted bentonite since diffusion rates have been measured in ‘‘through-diffusion’’ tests […]
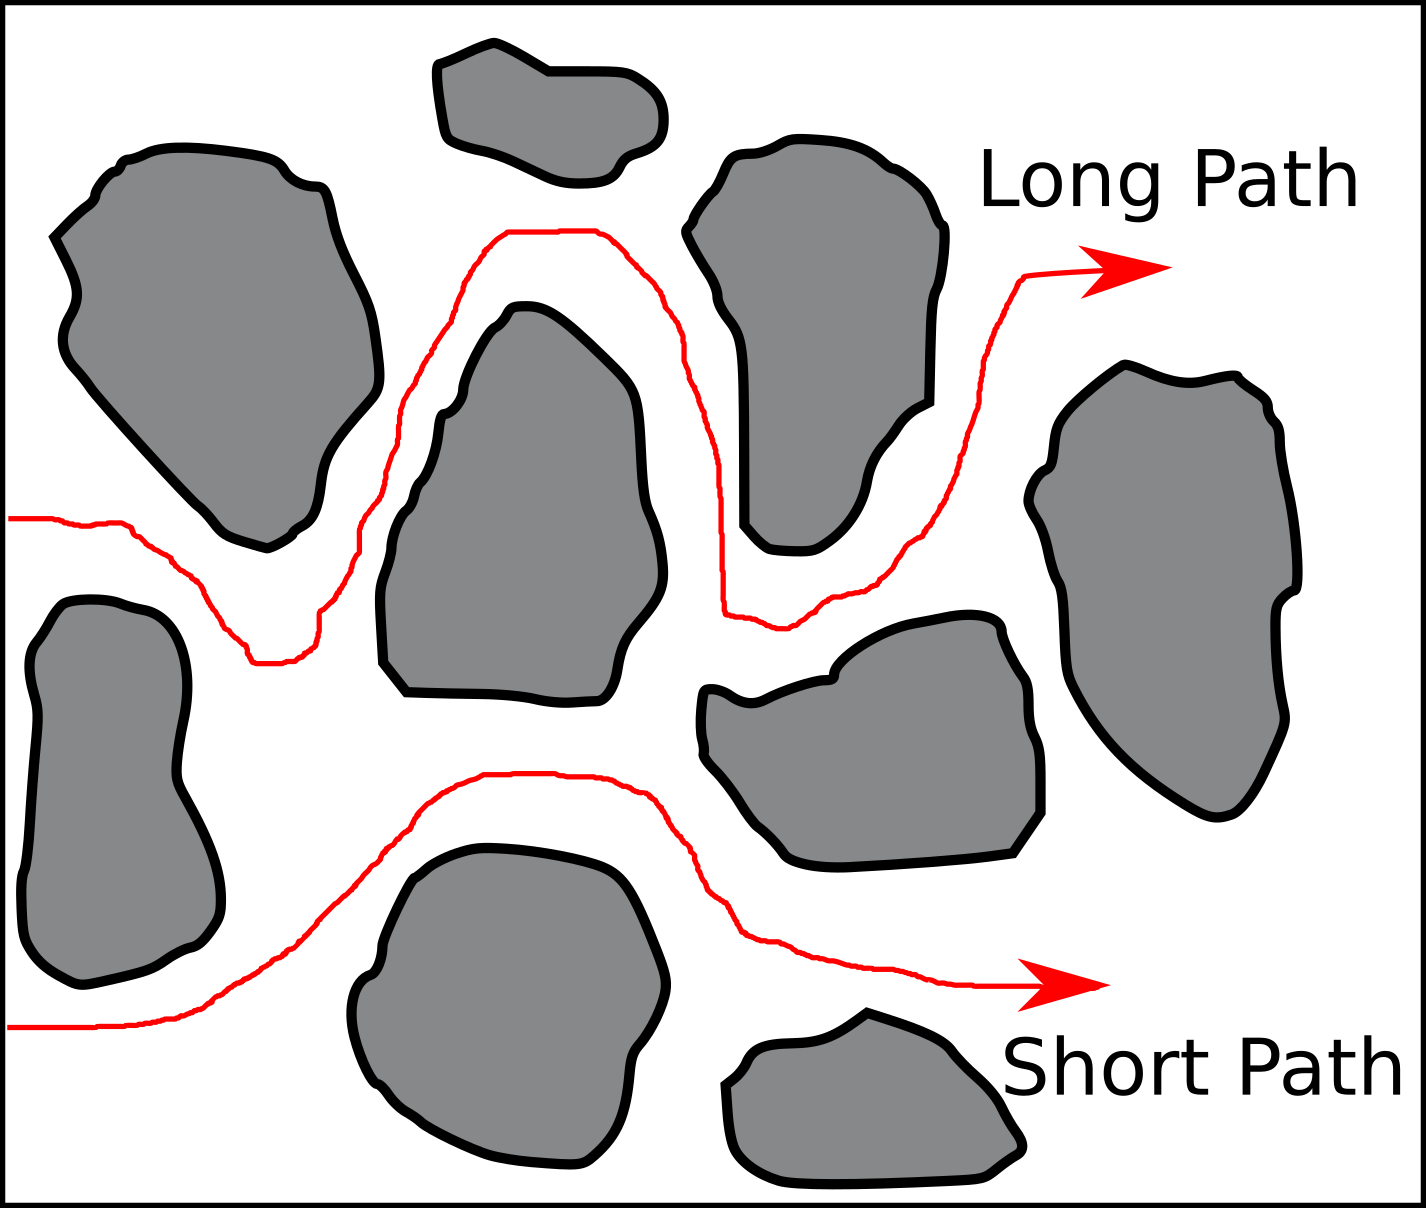
If the Cl anions cannot move through the interlayer and overlapping double layer regions because of anion exclusion effects, then it is reasonable to propose that the ‘‘free water’’ must provide the diffusion pathways (Fig. 1). Therefore, the hypothesis is that the pore volume associated with the transport of chloride (and other anions) is the ‘‘free water’’ volume, and that this is the porewater in a compacted bentonite.
Here they refer to Bolt and De Haan, (1982)5 when arguing for that anions do not have access to interlayers. But the analysis in this reference is based on nothing but — the Poisson-Boltzmann equation! (which predicts anions everywhere)
Another thing to note is the notion of “overlapping” diffuse layers. Studies of negative adsorption to quantify surface area typically look at soil suspensions, with a solid part of a few percent. In such systems it is justified to perform the analysis on a single diffuse layer because the distance between separate montmorillonite particles is large enough. But at higher density there is not enough space between separate clay particles for the ion concentrations to ever reach the “external” value (\(c_0\)) — the diffuse layers “overlap”.6
It has been shown that effects of “overlapping” diffuse layers on the resulting negative adsorption is significant already at a a solid content of 6%. When carrying over the anion exclusion analysis to compacted bentonite — with solid content typically above 70%! — it therefore becomes near impossible to believe that the system should contain regions unaffected by the montmorillonite (“free water”). Yet, the argumentation above, apart from being flawed in the way it refers to the Poisson-Boltzmann equation, relies critically on the existence of such regions.
The mindful reader may remark that compacted bentonite, if it mainly contains “overlapping” diffuse layers, perhaps is devoid of anions after all. But the Poisson-Boltzmann equation predicts anions everywhere also for “overlapping” diffuse layers. Actually, the model by Soudek et al. (1984), discussed above, considers this case.
Despite the improbability that montmorillonite particles in compacted bentonite can be spaced so far apart as to allow for bulk water within the system, the idea of anions only having access to “free” water was nevertheless further pursued by Van Loon et al. (2007). They provide a picture similar to this

The idea here (and elsewhere) is that bentonite consists of “stacks” of individual montmorillonite particles (TOT-layers) interlaced with interlayer water.7 The space between “stacks” is assumed large enough for diffuse layers to fully develop, and to merge into a bulk solution (“free water”), whose volume depends on the ionic strength, reminiscent of the excluded volume in eq 1.8 Anions are postulated to only have access to this “free” water.
But as references for anion exclusion is once again simply given studies based on the Poisson-Boltzmann equation (in particular, Bolt and De Haan, (1982)). But these — as I hope has been made clear by now — predict anions everywhere, and consequently do not support the suggested model. In this case, the mismatch between model and supporting references stands out, as the term “effective porosity” is used interchangeably with the term “Cl-accessible porosity”; if Gouy-Chapman theory in a convoluted way can be used to define an “effective” porosity (having no other meaning than a fictitious, equivalent volume), there is no possibility whatsoever to use it to support the idea of anions having access to only parts of the pore space. Ironically, “anion-accessible porosity” seems to be the most popular term nowadays for describing effects of anion exclusion in compacted bentonite.
The strongest confirmation that the modern-day concept of anion-accessible porosity is simply a misuse of the exclusion-volume concept is given in Tournassat and Appelo (2011). They provide a quite extensive background for the type of anion exclusion they consider, and it is based on the excluded-volume concept discussed above. They even explicitly calculate the excluded-volume (named “total chloride exclusion distance”) only to directly discard it as not suitable
However, this binary representation (absence or presence of chloride, Fig. 3) is not very representative of the system since the EDL is not completely devoid of anions.
Yet, after making this statement that anions are everywhere (in the diffuse layer) they anyway define anion accessible porosity as an effective, fictitious volume!9
Interlayers
Apart from treating the diffuse layer incorrectly, Bradbury and Baeyens (2003), Van Loon et al. (2007) and Tournassat and Appelo (2011) all make the additional unjustified assumption that interlayers — which in these studies are defined as distinctly different from diffuse layers10 — are completely devoid of anions. Bradbury and Bans (2003) cites conventional Poisson-Boltzmann based studies to incorrectly support this claim (see above). Also Van Loon et al. (2007) use Bolt and De Haan, (1982) as a reference11
Due to the very narrow space, the double layers in the interlayers overlap and the electric potential in the truncated layer becomes large leading to a complete exclusion of anions from the interlayer (Bolt and de Haan, 1982; Pusch et al., 1990; Olin, 1994; Wersin et al., 2004). The interlayer water thus contains exclusively cations that compensate the permanent charges located in the octahedral layer of the clay.
Of the other sources cited, Pusch et al. (1990) mention “Donnan exclusion” as the reason preventing anions from having access to interlayers. But this is incorrect – Donnan equilibrium always gives a non-zero anion concentration in the interlayer (as long as the external concentration is non-zero). Wersin et al. (2004) only claim that anions are “excluded” from interlayers, without further explanation or references. (I haven’t managed to read Olin (1994) .)
Tournassat and Appelo (2011) cites Bourg et al. (2003) to support the claim that anions have no access to interlayers
When the dry density is above \(1.8 \;\mathrm{kg/dm^3}\), almost all the porosity resides in the interlayers of Na-montmorillonite. Since anions are excluded from the interlayers, the anion-accessible porosity becomes zero, and anion-diffusion is minimal (Bourg et al., 2003)
But in Bourg et al. (2003) is explicitly stated that anion exclusion from interlayers is only “partial”!
To sum up…
The idea that anions have access only to parts of the pore volume is widespread in today’s compacted bentonite research community. In this blog post I have shown that this idea emerges from misusing the concept of exclusion-volume, and that all references used to support ideas of “complete exclusion” rests on the Poisson-Boltzmann equation. The Poisson-Boltzmann equation, however, predicts anions everywhere! Thus, the concept of an anion-accessible porosity, and the related idea that compacted bentonite contains different “types” of water, have not been provided with any kind of theoretical support.
In contrast, the result that anions have access to the entire pore volume is further supported both by molecular dynamics simulations, as well as by the empirical evidence for salt in interlayers.
Footnotes
[1] This figure is just an illustration, not an actual result. Update (220831): Actual solutions to the Poisson-Boltzmann equation are presented here.
[2] Schofield writes with an enthusiasm seldom seen in modern scientific papers: “I considered that it would be possible to compute the negative adsorption of the repelled ions from the basic assumptions of Gouy’s theory of the diffuse electric double layer, and therefore invited Mr. M. H. Quenouille to tackle the mathematical difficulties involved. Complete solutions have now been obtained for electrolytes in which the ions have valency ratios 1:2, 1:1, and 2:1, and a full account of this work will be submitted for publication shortly.”
[3] “Bentonite” is used in the following as an abbreviation of “Bentonite and claystone”.
[4] I mean that the word “probably” as used here does not belong in a scientific text.
[5] Sciencedirect.com dates this reference to 1979. The book has a second revised edition, however, published in 1982.
[6] I use quotation marks when writing “overlap” because I think this wording gives the wrong impression in compacted clay: with an average distance between montmorillonite particles of around 1 nm, the concept of individual diffuse layers has lost its meaning.
[7] I plan to comment on “stacks” in a future blog post. Update (211027): Stacks make no sense.
[8] The volume is, however, not proportional to the Debye length, but depends exponentially on ionic strength.
[9] The “anion accessible porosity” is defined in this paper as \(\epsilon_{an} = \epsilon_{free} + \epsilon_D\cdot c_D/c_{free}\), where \(\epsilon_{free}\) is the porosity of a presumed bulk water phase in the bentonite, and \(\epsilon_D\) quantifies the volume of an arbitrarily chosen “Donnan volume” which is (Donnan) equilibrated with the “free” solution. \(c_D\) is the anion concentration in this “Donnan volume”, and \(c_{free}\) is the anion concentration in the bulk water.
[10] In this context, “interlayers” are defined as being parts of “stacks”. I really need to write about “stacks”… Update (211027): Stacks make no sense
[11] Bolt and de Haan (and others) are fond of writing that anions in very narrow confinement are “almost completely excluded” or “virtually completely excluded”, indicating that they may neglect anions in these compartments, but also that they are aware of that the equations they use never give exactly zero anion concentration. When working with soil suspensions of only a few percent solids it may be a valid approximation to neglect anions in nm-wide pores. In compacted bentonite it is not.