
Over a long period on the blog, we have systematically examined studies on chloride equilibrium in sodium dominated bentonite. We have now individually assessed each study that was deemed to have potential to provide relevant information. In this blog post we make some overall conclusions and give an updated picture of what is actually known empirically regarding chloride equilibrium in bentonite.
The assessment included seven studies, which are summarized in the table below. The table also provides links to each individual assessment.
| Study | Type | Material | Verdict | Remark | Relevance |
| Mu88 | Diffusion (p) | “MX-80” | Fail | Data too uncertain | – |
| Mo03 | Diffusion (p) | “MX-80” | Fail | Data too uncertain | – |
| Mu04 | Equilibrium | Na-mmt | Fail | Data too uncertain | – |
| Mu07 | Equilibrium | Na-mmt | Fail?4 | Too little info | – |
| Vl07 | Diffusion/ Equilibrium | “KWK” | Pass | Influenced by Ca/Na ratio | Yes |
| Is08 | Diffusion (p) | “Kunigel V1″/ “Kunipia F” | Pass | unnecessary complex setup Influenced by Ca/Na ratio | No5 |
| Gl10 | Diffusion | Na-mmt | Pass? | Increasing retardation with decreasing background concentration | No5 |
These studies are the only ones, to my knowledge, that meet the following criteria:
- They involve chloride
There are both theoretical and empirical arguments for that different anions may have different equilibrium concentrations (for otherwise similar conditions). In the assessment it has therefore been important to stick to one and the same type of equilibrating anion. Moreover, chloride is certainly the anion that has been studied the most within bentonite research, with iodide as its closest “competitor”.
- They involve sodium dominated bentonite
This include commercial products, such as “MX-80”, “Kunigel V1” or “Kunipia F”, or materials that were intentionally prepared for the study (more or less pure Na-montorillonite).
Some studies exist where ion equilibrium is explored in other systems, e.g. claystone or bentonites dominated by divalent counter-ions. But, since we have every reason to belive that the conditions for ion equilbrium are different in such systems, as compared to Na-bentonite, we must be careful not to include them in the analysis. We shouldn’t compare apples and oranges.
- They have a specified external sodium solution
Without some knowledge of the composition of the solution in contact with the sample, an evaluated chloride concentration cannot be related to any relevant equilibrium condition. Furthermore, if the water chemistry of the equilibrating solution is too complex (e.g. involving several cations), the equilibrium cannot in a reasonably straghtforward manner be related to chloride concentrations in a sodium dominated system.
- They have a systematic variation of either density or external background concentration or both
My main motivation for making these assessments is for using equilibrium data to better understand salt exclusion in bentonite. This can reasonably only be achieved if density and/or background concentration has been systematically varied.
In the following we will refer to each study with the identifying label listed in the table above.
Comments
Through-diffusion is unneccesary
A majority of the examined studies are through-diffusion studies (Mu88, Mo03, Vl07, Is08, Gl10). A through-diffusion test set-up is, in fact, much more complex than required for only studying equilibrium quantities: it involves monitoring the chemical evolution of the external solutions (often using radiochemical methods), and the final state (steady-state) concentration profile is often extracted, by meticulously sectioning and analyzing the sample (studies where final state profiles were extracted are indicated by a “p” in the above table).
Additionally, extracting relevant information from flux data requires fitting a two-parameter model. In all assessed diffusion studies, one parameter relates to mobility (either an “effective” or an “apparent” diffusion coefficient) and one to ion equilibrium (“effective porosity”, “anion-accessible porosity”, or a “capacity factor”).1 Consequently, through-diffusion tests, despite their complexity, only provide indirect estimates of equilibrium concentrations, and the accuracy of the estimated parameters naturally depends on details of the fitting procedure and the sampled data. In this regard, most of the studies we have examined report inferior fitting procedures and flux data, where the transient stage of the process has not been adequately sampled (the only exception being Gl10).2 Estimated “effective porosities” are therefore not very reliable. This imprecision can sometimes be mitigated by also using information on the final state concentration profile. But this part of the analysis then essentially corresponds to making a quite complicated equilibrium test. Two of the five diffusion studies — Mu88 and Mo03 — were discarded because evaluated parameters (and the underlying data) are too uncertain.
From an ion equilibrium perspective, through-diffusion tests are consequently not very “economical”. The obvious alternative are straightforward equilibrium tests, where samples simply are equilibrated with specified external solutions. This can in principle be done without monitoring, and only requires the patience to wait long enough. The lack of any requirement to monitor these types of tests also makes them suitable, I imagine, for involving many samples without significantly increasing the experimental workload.
Most equilibrium tests have not been adequately performed
Although they are conceptually much simpler, only two of the assessed studies are pure equilibrium tests (Mu04 and Mu07). A third (Vl07) performed explicit equilibrium measurements as part of a diffusion study.
Essentially all studies in the assessment that have recorded concentration profiles show interface excess, i.e. an increased amount of ions near the edges as compared with the interior of the samples. As this effect seems to be universal,3 it must be accounted for when making equilibrium tests, or evaluated concentrations will be overestimated. Doing this should be quite straightforward, by, for example, quickly sectioning off the first few millimeters on both sides of the samples during dismantling. Unfortunately, this has not been done in the assessed equilibrium studies,4 which makes them unsuitable. Vl07, on the other hand, recorded full profiles, and the excess effect was accounted for.
Relevant parameter ranges
After discarding two diffusion studies and two equilibrium studies, only three studies remain for which the evaluated equilibrium concentrations are deemed sufficiently accurate: Vl07, Is08 and Gl10.
But we should also consider the relevance of the chosen density and background concentration ranges — something that has not been discussed to any greater extent in the individual assessments. My main motivation for performing this assessment is for using equilibrium concentration data for testing models for salt exclusion in compacted bentonite. A full understanding of ion equilibrium in such systems is crucial for e.g. a relevant chemical description of bentonite buffers in radioactive waste repositories. Therefore, a preferred effective montmorillonite density range is approximately 1.2 — 1.7 g/cm3, say.
With also this criteria in mind, we may therefore rule out two of the three remaining studies; Is08 treats low density systems (\(<\) 1.0 g/cm3), and Gl10 only considers an extremely high high density (1.9 g/cm3).5 This leaves us with a single study that passes both the test of providing accurate data on chloride equilibrium concentrations and being measured in relevant parameter ranges: Vl07. This study covers the approximate density range 1.15 — 1.75 g/cm3, and concentration range 0.01 — 1.0 M.
A single relevant study
On the one hand, it is great news that we have verified some data as actually useful for evaluating salt exclusion in compacted bentonite. On the other hand, it is very unfortunate that there only is one single study!
Moreover, although the results of Vl07 most definitely are useful, they are not optimal. A more “pragmatic” problem with this study is that it reports whole sets of “Cl-accessible porosities”1 for each sample tested, together with an average value. But these different values simply reflect the uncertainty of the parameter for individual samples. If the study had no issues (experimental or modeling related), these values should all be the same, as they are evaluated from one and the same sample. In our assessment we identified that the major part of this uncertainty stems from evaluations from diffusion modeling, while estimations made from equilibrium considerations are more robust (total out-diffusion and stable chloride content). It is thus these estimations in Vl07 that are deemed useful, while the diffusion estimations should be discarded. Note that, since “Cl-accessible porosities” estimated from flux data are sub-optimal, so are the reported average values.
Unfortunately, several studies have used or reported the Vl07 data (as well as other data we have assessed) without sufficient rigor when evaluating salt exclusion in compacted bentonite. As a relatively recent example of this, Gimmi and Alt-Epping (2018) compare two models for chloride exclusion with empirical data in a figure that looks very similar to this6
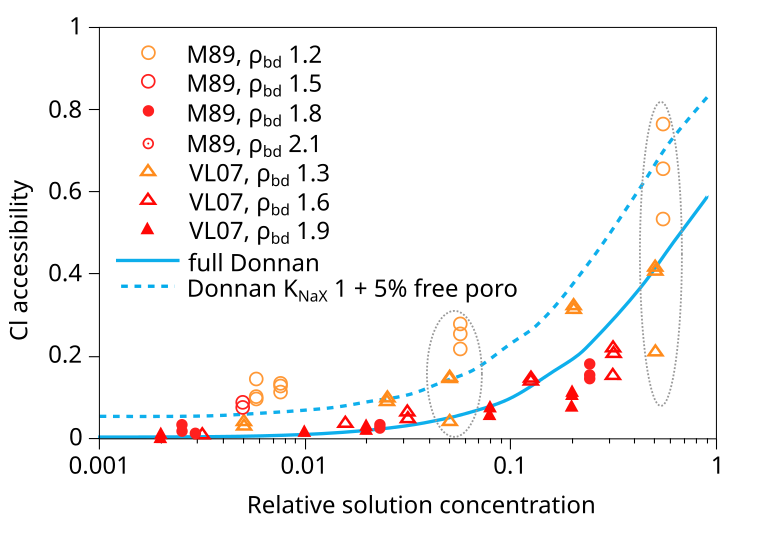
In addition to the VL07 data, this plot also compare with data from Mu886 — a study that we have discarded. Taking the above plot at face value it is hard not to wonder what use the experimental data really has — the spread at certain places is almost an order of magnitude (indicated in the figure). You can basically fit any favorite model to this data (or rather, you can fit no model to this data). Gimmi and Alt-Epping (2018) anyway compare the data with two Donnan equilibrium models. One (“full Donnan”) is essentially equivalent to the homogeneous mixture model (all pore space is treated equally), while the other includes several specific additional model components (“free” porosity, exchange “sites”). Gimmi and Alt-Epping (2018) use this plot to argue for that these particular additional components become significant for bentonite at the lower density. But if we “clean up” the plot and only use data points that has passed the present assessment, the picture is instead this
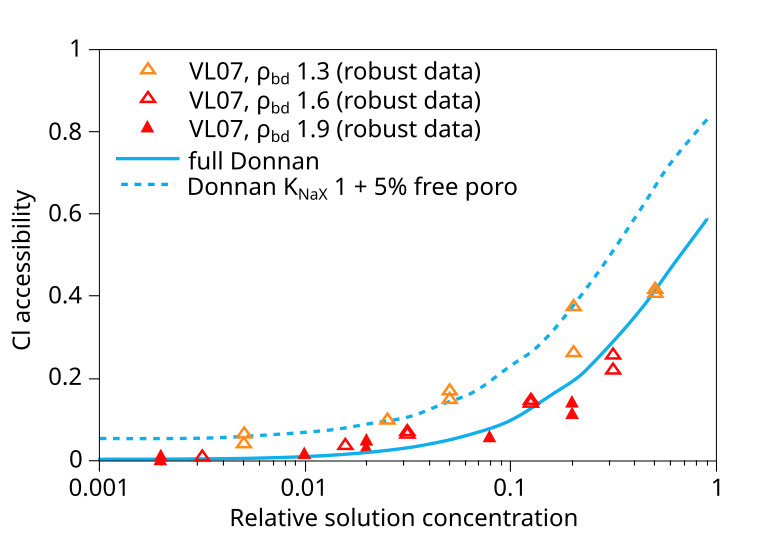
With this version of the data we can at least convince ourselves that it obeys the rules for Donnan equilibrium. But I mean that it is hard to draw any more detailed conclusions than that. In particular, it is a hard stretch to believe that the suggested more complex model has any particular significance.7
The Vl07 data also has the more fundamental problem that the detailed ionic composition of the system is not fully controlled. This is actually the case for all assessed studies that use “natural” bentonite rather than specifically prepared homoionic clay, and relates to to the presence of uncontrolled amounts of divalent cations.
Problems with ignoring the detailed equilibrium conditions
When “natural” bentonites — which generally contain more than one type of cation — are contacted with a pure sodium solution, it is inevitable that the material and the solution begin exchanging cations. Furthermore, since these materials contain accessory minerals, dissolution/precipitation processes are most probably also initiated. Thus, at the time when the equilibrium concentration is recorded, the exact chemical conditions are typically not known. In particular, it is not clear exactly what e.g. the Na/Ca ratio is in the clay. To make issues worse, the extent of this effect depends significantly on the concentration of the external solution, where we expect a purer sodium clay for higher external concentrations. Since the external concentration is often varied by orders of magnitude in these studies, this implies that quanities evaluated at different concentrations most likely correspond to slightly different systems (e.g. clay samples with different Na/Ca ratios). Thus, even if we have taken measures when selecting studies to not compare apples and oranges, this problem partly remains.
Relevant data for chloride equilibrium concentrations
Below is plotted the chloride equilibrium data that has been found robust and relevant in the assessment (i.e. part of the data reported in Vl07)
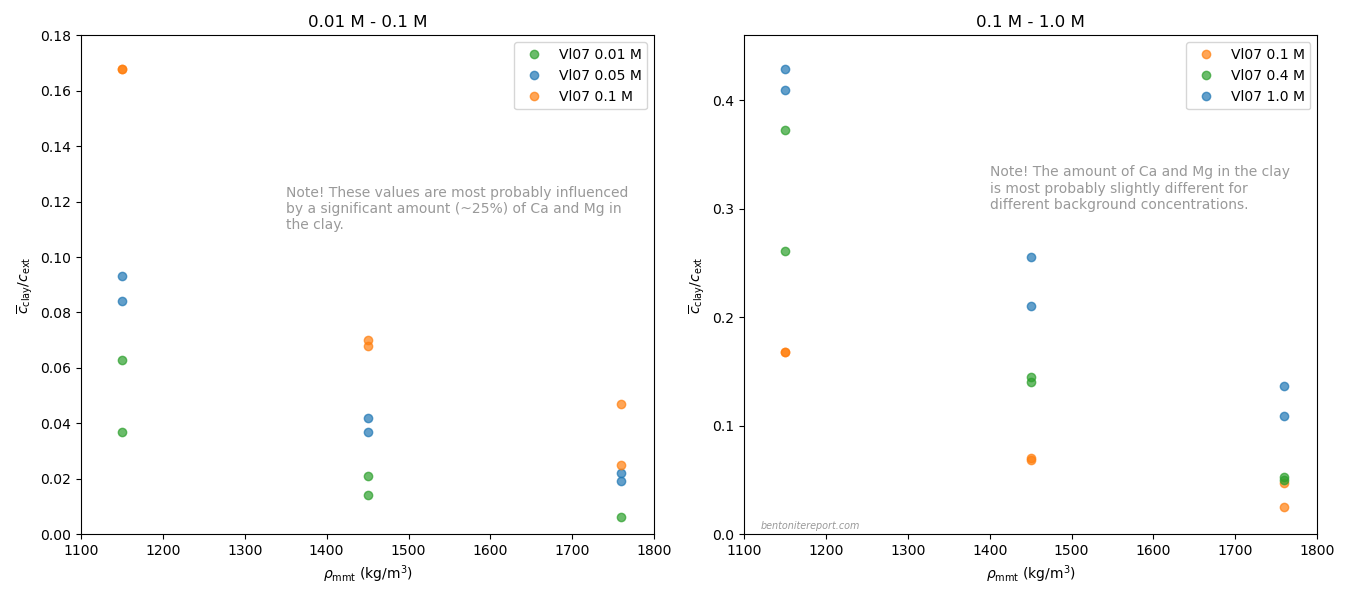
These values have been evaluated from the “Cl-accessible porosities” reported in table 6 in Vl07.8 The exact values of equilibrium concentration ratios and effective montmorillonite densities depend on adopted values for grain density and montmorillonite content. Here we have adopted \(\rho_s\) = 2800 kg/m3 and 80% montmorillonite. Note that equilibrium concentrations and densities are burdened with additional uncertainties that are not indicated in the above diagram. Note also that although most conditions in the above plot have two data points, these correspond to a single sample. For more details we refer to the individual assessment.
Comparing the above plot with the one presented in the initial blog post on the assessment — which included all available data — we note a considerably less chaotic picture. At least, the robust Vl07 data gives evidence for the two main features that we discussed in the initial blog post:
- Chloride exclusion increases with increasing density at constant background concentration
- Chloride exclusion decreases with increasing background concentration at constant density
It must be emphasized that the Vl07 data most probably has a systematic “error”, in the sense that the data for lower background concentrations (0.01 — 0.1 M) most probably is influenced by a significant amount of divalent exchangable cations in the clay (Ca and Mg). In contrast, for higher background concentrations (0.4 M, 1.0 M), the clay is most probably in a purer sodium state.
A hundred labs should each make a hundred equilibrium tests!
After finishing this assessment the loudest question in my head is: why are not a hundred labs already on their way to each make a hundred equilibrium tests? Not only has the bentonite research sector failed when we must rely on a single soon 20-year-old study to have some idea of chloride equilibrium in sodium dominated bentonite. For other anions we essentially have no systematic data! As mentioned above, a general understanding of ion equilibrium is required in order to perform relevant chemical modeling of e.g. bentonite buffers in radioactive waste repositories.
- Chloride content: UNKNOWN
- Extracting anion equilibrium concentrations from through-diffusion tests
- Assessment of chloride equilibrium concentrations: Muurinen et al. (1988)
- Assessment of chloride equilibrium concentrations: Molera et al. (2003)
- How salt equilibrium concentrations may be overestimated
- Assessment of chloride equilibrium concentrations: Muurinen et al. (2004)
- Assessment of chloride equilibrium concentrations: Van Loon et al. (2007)
- Assessment of chloride equilibrium concentrations: Muurinen et al. (2007)
- Assessment of chloride equilibrium concentrations: Ishidera et al. (2008)
- Assessment of chloride equilibrium concentrations: Glaus et al. (2010)
Footnotes
[1] Here we do not discuss the reasonability of these models and model parameters. I am, however, arguing heavily in many other places on the blog that none of them are conceptually sound. Here I have described how experimentally accessible equilibrium concentrations can be extracted from “anion-accessible porosity” parameters.
[2] This bad test design is still very common. Through-diffusion tests should reasonably be designed so that the outflux curve can be adequately sampled. As this curve behaves drastically differently in the transient and in the steady-state stages, the sampling frequency should reasonably be adapted.
As an example, if a lab has the capacity to make measurements at most every second day (as is done in e.g. Vl07), I suggest starting diffusion tests on a Friday and design them so that essentially no tracers reaches the target reservoir during the weekend. This can be achieved by aiming for a breakthrough time of about 20 days. The breakthrough time is related to diffusivity (\(D\)) and sample length (\(L\)) as \begin{equation*} t_\mathrm{bt} = \frac{L^2}{6D} \end{equation*} Consequently, to keep \(t_\mathrm{bt}\) relatively constant, sample lengths should be adjusted depending on the expected value of the diffusivity. For a breakthrough time of 20 days, \(D = 10^{-10}\) m2/s corresponds to \(L=32\) mm, and \(D = 10^{-11}\) m2/s to \(L=10\) mm.
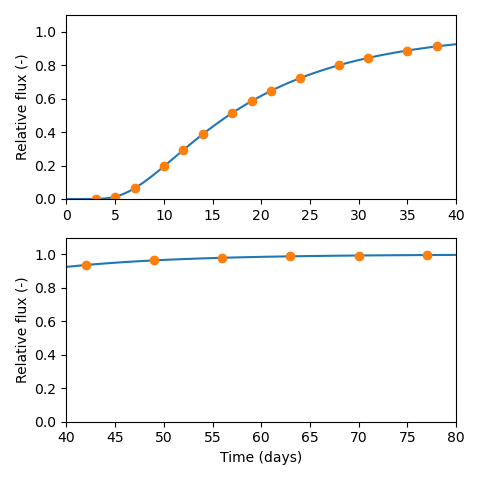
With a breakthrough time of about 20 days, and tests started on Fridays, I suggest the following measurement protocol
- 3 times a week the first 3 weeks (Monday, Wednesday, Friday)
- 2 times a week the following 3 weeks (Monday, Friday)
- 1 time a week the following 5 weeks (Friday)
This would give sampling at 20 occasions over about 80 days that ideally corresponds to four times the breakthrough time, like this
However, I further argue for that through-diffusion tests generally should be avoided. Diffusivities are more conveniently (and quickly) measured in closed-cell tests. Likewise, for equilibrium properties it is obviously better to perform equilibrium tests. Through-diffusion tests, in my opinion, are only motivated under particular circumstances, e.g. for making several non-destructive measurements in the same sample under various conditions.
[3] I am fully convinced that this is an effect due to swelling during sample dismantling. Molera et al. (2003) and Glaus et al. (2011) have presented other interpretations, which we have briefly discussed in the assessments. I intend to write a future separate blog post on this topic.
[4] Sample information in Mu07 is sparse and it is not clear how dismantling has been performed, but nothing suggests that interface excess has neither been identified nor handled. In the individual assessment of this study I came to the conclusion that this data after all can be useful for evaluating models for salt exclusion. Here I anyway discard the results, mainly due to the above mentioned lack of information. This data should be kept in mind, however.
[5] Both Is08 and Gl10 provide interesting information, which should not be completely forgotten. In particular, Is08 report results for extremely high background concentrations (5.0 M). Gl10, on the other hand, show a dependency on background concentration of the diffusivity not seen in other tests. I was not able to rule out this effect as an artifact and therefore encourage the bentonite research community to help clarify what is occurring in these specific systems.
[6] The reference for the points labeled “M89” in Gimmi and Alt-Epping (2018) is Muurinen et al. (1988), i.e. Mu88. I have not changed the label, however, because the plot contains more data than what is reported in Mu88. I have not been able to identify the source for this additional data. We may also note that the Vl07 data reported here appears to be quite randomly chosen; for some systems are chosen data evaluated from diffusion, for others, data evaluated from equilibrium measurements.
[7] On the contrary, there are many additional arguments for that sodium bentonite at 1.3 g/cm3 does not contain significant amounts of “free” porosity. Moreover, in my head, the procedure of treating ion exchange with both a Donnan equilibrium model and a surface site sorption model can only lead to overparameterization problems. It is also unreasonable in this context to add conceptually completely different features before the “full Donnan” model is treated in full, e.g. by including activity corrections.
[8] One entry in that table, for stable chloride at 1.9 g/cm3 and background concentration 0.01 M, has been discarded. The table also appears to contain a couple of typos, which have been corrected.