
In the ongoing assessment of chloride equilibrium concentrations in bentonite, we here take a closer look at the study by Muurinen et al. (2004), in the following referred to as Mu04. We thus assess the 25 points indicated here

In contrast to the earlier assessed studies, Mu04 is not a diffusion study, but considers directly the clay concentration in samples equilibrated with an external solution. Moreover, Mu04 uses purified “MX-80” bentonite, ion exchanged to a more pure sodium form.
Mu04 contains data from two quite different types of samples. 15 samples originate from a study on pressure response in montmorillonite contacted with external NaCl solutions of varying concentration (Karnland et al., 2005; in the following referred to as Ka05). The remaining 10 samples were prepared for determining basal distance using small-angle X-ray scattering (SAXS). We refer to these two sets of samples as the swelling pressure samples and the SAXS samples, respectively. A more detailed description of the sample analysis is given in Muurinen (2006), in the following referred to as Mu06.
Material
The used material is referred to as “purified MX-80”. Mu06 states that this material was produced by mixing “MX-80” powder and NaCl solutions in bottles, where the solutions were repeatedly replaced. Mu06 also states that “During this process, part of the dissolving accessory minerals was removed as well.” Ka05 more explicitly say that the raw material was “converted into a homo-ionic Na+ state and coarser grains were removed (Muurinen et al., 2002). The montmorillonite content was thereby increased to above 90% of the total material.”1 With no better estimate of the montmorillonite content, we therefore associate the stated densities with effective montmorillonite dry density, i.e. we assume a montmorillonite content of 100%. We should keep in mind the uncertainty of this parameter, and that, reasonably, this choice somewhat overestimates the effective montmorillonite dry density.
The purified material was found to leach sulfate and carbonate, indicating that it still contains some amount of soluble accessory minerals. It follows that the montmorillonite is not completely of pure sodium form, as confirmed by the reported exchangeable ion population: 0.74 eq/kg sodium, 0.06 eq/kg calcium, and 0.03 eq/kg magnesium (i.e. a di/mono-valent ratio of about 10/90). It is interesting that the material still contains a non-negligible amount of divalent ions, given that quite a lot of effort was put into producing it. Nevertheless, we can assume that this material contains considerably more sodium as compared with the “raw” “MX-80” encountered in the previously assessed studies.
Samples overview
The swelling pressure samples were originally cylindrical, with diameter 5 cm and length 2 cm, giving a volume of approximately 39 cm3. After termination of the swelling pressure tests, these samples were cut into pieces, to be used for different types of analyses. The samples cover large ranges of density and external NaCl concentration, as listed here
| Sample-ID2 | NaCl conc. (M) | \(\rho_d\) (nominal) (g/cm3) |
| S2-21 | 0.1 | 0.786 |
| S2-02 | 0.1 | 0.786 |
| S2-04 | 0.1 | 1.257 |
| S2-17 | 0.1 | 1.571 |
| S2-18 | 0.1 | 1.729 |
| S2-13 | 0.3 | 0.786 |
| S2-14 | 0.3 | 1.257 |
| S2-15 | 0.3 | 1.571 |
| S2-16 | 0.3 | 1.729 |
| S2-05 | 1.0 | 1.257 |
| S2-08 | 1.0 | 1.571 |
| S2-11 | 1.0 | 1.729 |
| S2-06 | 3.0 | 1.257 |
| S2-09 | 3.0 | 1.571 |
| S2-12 | 3.0 | 1.729 |
Neither Mu04 nor Mu06 provide much information about preparation and handling of the SAXS samples. It is stated that these are cylindrical with diameter 2.5 cm and length 0.5 cm, giving a total volume of 2.45 cm3. Although not stated, also these sample have reasonably been sub-divided, as e.g. density was determined (and some parts were obviously used for SAXS).
The SAXS samples varies substantially in density, but were only contacted with external NaCl solutions of concentration 0.1 or 0.3 M. The table below identifies each sample by external solution concentration and, presumably, measured density (how density was determined is not reported)
| NaCl conc. (M) | \(\rho_d\) (measured?) (g/cm3) |
| 0.1 | 0.750 |
| 0.1 | 0.875 |
| 0.1 | 1.225 |
| 0.1 | 1.516 |
| 0.1 | 1.543 |
| 0.3 | 0.954 |
| 0.3 | 1.058 |
| 0.3 | 1.206 |
| 0.3 | 1.559 |
| 0.3 | 1.662 |
In the following, we separately discuss the chloride concentration evaluations of the swelling pressure samples and the SAXS samples.
Swelling pressure samples
Chloride concentration was evaluated3 in three separate pieces of each original sample, as indicated in this figure:4

Chloride content was determined by dispersing each piece, containing about 1 g of clay, in de-ionized water, centrifuging, and analyzing the supernatant. The pieces were located at different heights of the original cylinder (see figure), giving some spatial resolution of the chloride distribution, reported in Mu06. Mu04, however, only report the average value for each sample. For some samples, the value reported in Mu04 does not perfectly match the average calculated from the values listed in Mu06 (cf. the plots below).
Let’s anticipate the “verdict” for these samples: the evaluated clay concentrations are not useful for quantitative understanding of ion equilibrium, and I will not use them e.g. for validating anion exclusion models.
That these samples are not adequately equilibrated is best seen from looking at the evaluated concentrations in the samples contacted with 0.1 and 0.3 M NaCl, here plotted with spatial resolution

The indicated densities (\(\rho_d\)) are the average of the spatially resolved values reported in Mu06 (these differ a bit from what is reported in Mu04). The profiles show several peculiarities:
- The densest samples in both test sets (S2-18 and S2-16, respectively) contain the second highest amount of chloride.
- Samples S2-21 and S2-02 have a huge difference in chloride concentration, even though they have quite similar density.
- In both test sets, the chloride concentration is very similar in the samples with densities \(\sim\) 1.3 g/cm3 and \(\sim\) 1.6 g/cm3 (S2-04 vs. S2-17, and S2-14 vs. S2-15).
These observations strongly indicate that the samples either have not been adequately equilibrated, or that they have not been adequately handled after test termination (or both). Consequently, the results are of little help for adequate quantitative process understanding.5 Mu04 acknowledge this shortcoming, but takes different action
At high dry densities (>1630 kg/m3 ) and low NaCl concentrations, the concentrations in the porewater tend to increase with increasing density. The phenomenon is not seen with the thinner SAXS samples, however. One possible explanation is that during saturation too much chloride is transported into the sample and the equilibration time has been too short to reach the equilibrium. Three such samples marked with (*) in Tables 1 and 3 have been omitted from the treatment of the results.
But one cannot simply omit only the samples that deviate from the expected qualitative behavior while assuming that the rest of the results are adequate! This is especially true when the source for the shortcoming has not been clarified. In fact, we just identified additional peculiarities in the data. Consequently, not only should the rest of the samples equilibrated with 0.1 M and 0.3 M NaCl be omitted, but also those equilibrated with 1.0 M and 3.0 M.
For completeness, here are the chloride concentration profiles for the tests with high background concentration
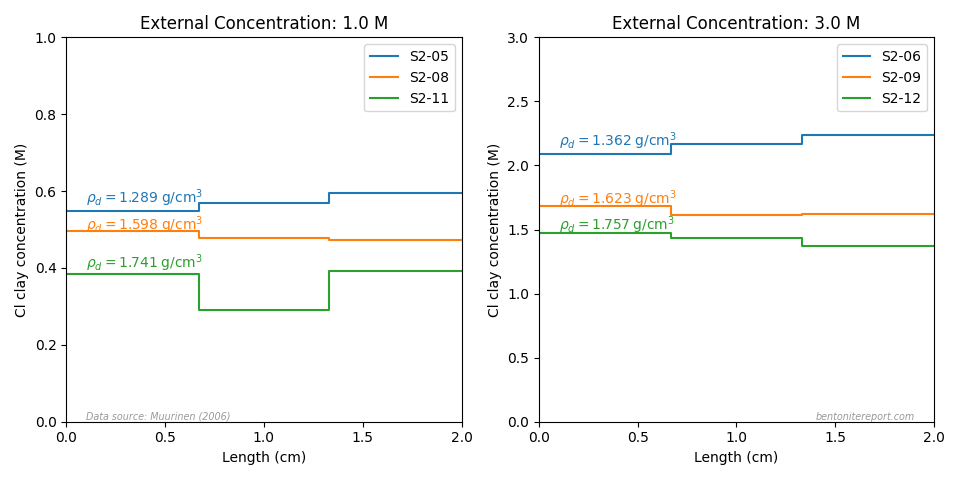
Although we discard them, it may be interesting to identify possible reasons for these flawed results. Previously, we discussed why equilibrium salt concentrations may be overestimated. Both factors identified there may apply here: failing to handle possible interface excess, and issues related to directly saturating samples with a saline solution.
Saturating with saline solutions
From the different reports it is clear that the samples were saturated directly with the saline solution. It is, however, not fully clear if the saturation was performed from only one end of the sample, or from both. In Mu04 and Mu06, the assumption seems to be that the samples were saturated from one side only, although this is not described in any detail. Mu04 write
The compacted samples were closed in metal tubes and saturated through a sinter at one end.
In Ka05, however, the statement is
The water solutions were slowly circulated behind the bottom filters to start with, in order not to trap the original air in the samples.
where the formulation “to start with” suggests that the solution was eventually also contacted from the top.
The reason why this detail may be important is that with solution at one end only the effective diffusion distance for salt is doubled as compared with having solution at both ends. A doubling of diffusion length, in turn, increases the characteristic diffusion time by a factor of 4.
We estimate the time needed for excess salt to diffuse out by considering a model with an initial unit concentration in the entire domain (domain length \(L\)), and boundary condition of zero concentration at the end points. The midpoint concentration in such a model, for various values of \(L\) (0.01 — 0.02 m) and diffusion coefficients (\(1\cdot 10^{-10}\) — \(1\cdot 10^{-11}\;\mathrm{m^2/s}\)), evolve like this
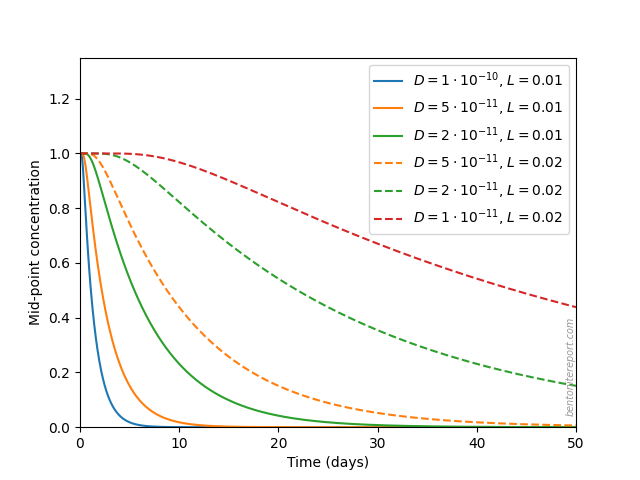
We see that, depending on parameter values, the set-up may be such that a possible “overshoot” of salt have not had time to completely diffuse out of the sample during the course of the swelling pressure tests, which were conducted for about a month. In particular, if the effective diffusion length was 2 cm during the major part of the saturation process, it is very plausible that the equilibrium process was not completed for certain samples (this depends of course also on the detailed values of diffusion coefficient and equilibration time).
Supported by this simple analysis, we cannot rule out that the samples initially took up more salt than dictated by the final state, and that this salt may not have had time to fully diffuse out again.
Interface excess
Concerning interface excess (a potential problem regardless of whether or not the sample has reached full equilibrium before termination), no detailed information is given on the dismantling procedure. It seems relatively clear, though, that the outer parts of the original samples were not sectioned off. Ka05 write
After reaching pressure equilibrium and a minimum test time of 1 month, the test solutions were disconnected and the samples were removed and split in order to make detailed analyses of the water ratio, sample density, pore-water chemistry, water activity and microstructure.
Mu06 writes (“Figure 4” is similar to the figure above)
The bentonite sample cylinders obtained from the swelling pressure measurements were cut into smaller pieces according to Figure 4 in order to provide samples for different analyses and measurements. Half of the sample piece was used for the porewater studies while the other half […] was left in Clay Technology AB for their studies.
My interpretation is that the original sample was cut in half during the dismantling in the swelling pressure study, and that one half was sent off elsewhere for the analysis presented in Mu04 (the upper part of the disc indicated in the above figure). Thus, it seems plausible that the interface regions were not sectioned off during dismantling, and that the samples were stored/transported for an appreciable amount of time. Possible excess salt would consequently had time to even out in the sample before further analysis. This interpretation is in line with the evaluated rather flat chloride profiles: note the contrast between these and the quite pronounced non-linear profiles observed at the interfaces in studies where samples are sectioned at test termination.
SAXS samples
Mu04 (and Mu06) provide almost no information about how the SAXS samples were handled. Reasonably, also these samples were split, with some part being used for the SAXS measurement and another for determining water content, but we have no information on this. In fact, not even the SAXS results are properly reported for these samples; only evaluated “interlamellar spaces” for the samples equilibrated at 0.3 M are discussed; neither Mu04 nor Mu06 report SAXS data for the 0.1 M samples.
The reports are also somewhat contradictory. In the caption to a table in Mu04 it is stated that the SAXS samples were first saturated with de-ionized water, and thereafter equilibrated with the salt solutions. Mu06, on the other hand, states
The samples were compacted into the cells and saturated through a filter plate from one side with 0.1 or 0.3 M NaCl solutions for 12 days.
Should the last statement rather be that equilibration was performed for 12 days, after saturation? Under any circumstance, the lack of information on handling of the SAXS samples is a major flaw and must be considered in the assessment.
If I should guess, I believe that possible interface excess on these samples where not handled, i.e. I believe that the end parts were not sectioned off when the samples were dismantled (also, with only 5 mm thick samples, there is not much to section off…). Note that the SAXS samples are thin (5 mm) and were equilibrated with solutions of relatively low concentration (0.1 M and 0.3 M). Based on the analysis in the previous post, these samples are expected to be very sensitive to an interface excess effect.
Here is plotted the reported chloride clay concentrations for the SAXS samples, together with corresponding (average) values for the swelling pressure samples at the same background concentration6

Note that, although the density dependence on the SAXS sample data appears more reasonable compared with the swelling pressure samples, the SAXS sample data seem to have a scatter of at least a factor of 2 (see e.g. the leftmost SAXS points for 0.3 M and the rightmost points for 0.1 M). Note also that in one sample (0.1 M, 750 kg/cm3), the evaluated clay concentration is larger than the background concentration!
Summary and verdict
I discard the chloride concentrations measured in the swelling pressure samples, based on the reported results: it is clear that the observed scatter and spurious dependencies demonstrate that the samples were not properly equilibrated, in order to use the results for quantitative process understanding. To accept e.g. a result that the equilibrium chloride concentration increases with density I require a considerably more rigorous study. Moreover, I mean that all results must be discarded, not only those that obviously deviate from the expected qualitative behavior.
I also discard the results of the SAXS samples. Although we don’t have any clear indication that they were incorrectly prepared, I judge the uncertainties and lack of information to be too large in order to rely on the results. Almost no information is provided! Furthermore, the reports do not give any hint that the issue of interface excess is identified and handled — an effect we can expect to be substantial in these samples.
I am saddened to have to discard these results, because, in my mind, adequate results from equilibration of homo-ionic samples would be very valuable for increased process understanding. I strongly believe that the bentonite research community should strive for conducting many more of these relatively simple tests on purified clays, rather than complicated through-diffusion tests. In properly conducted equilibrium tests, concentration data is accessed directly and there is no risk for the results to be obscured by issues related to ionic transport.
- Chloride content: UNKNOWN
- Extracting anion equilibrium concentrations from through-diffusion tests
- Assessment of chloride equilibrium concentrations: Muurinen et al. (1988)
- Assessment of chloride equilibrium concentrations: Molera et al. (2003)
- How salt equilibrium concentrations may be overestimated
Footnotes
[1] The reference “(Muurinen et al., 2002)” appears to be what eventually became Muurinen et al. (2004); the 2002-reference is stated to be submitted to Applied Clay Science, but has the same title as the 2004-reference (published in Physics and Chemistry of the Earth).
[2] These IDs are used in Karnland et al. (2005) and Muurinen (2006), but not in Muurinen et al. (2004). Sample S2-21 is incorrectly specified in table 3 in Muurinen (2006) (but not in the actual tables of results). Karnland et al. (2005) report an additional sample — S2-22 — that is not included in Muurinen (2006) or Muurinen et al. (2004) (background concentration 1.0 M, density 0.786 g/cm3).
[3] Muurinen et al. (2004) also report chloride concentrations from so-called squeezing tests. Squeezing tests are not adequate for evaluating equilibrium clay concentrations, and I intend to write a future blog post on the subject. Here we simply ignore the squeezing results.
[4] The pieces labeled “B” were used to determine density (water content).
[5] This does not in any way alter the fact that the study has contributed greatly to qualitative process understanding: as we have discussed several times on this blog, Karnland et al. (2005) proves that anions have access to montmorillonite interlayers.
[6] The plots also show the difference in average concentration and density for the swelling pressure samples as reported in Muurinen et al. (2004) and Muurinen (2006); these points should lie on top of each other.