
Accurate experimental data is important for supporting bentonite model development. It both guides us when deciding what to include in a model and allows us to evaluate model performance. It is therefore distressing to note that the accumulated empirical data on “anion” exclusion gives a far from coherent picture. Let’s have a look.
Although the phenomenon being modeled often is referred to as anion exclusion, data mainly exists for chloride. We therefore restrict ourselves to look at reported equilibrium values for chloride1 in bentonite.
For an equilibrium value to be relevant, the sample in which it was measured must be specified, as well as the corresponding composition of the external solution. Published equilibrium values have almost exclusively been measured in samples of sodium dominated bentonite of various density — either purified Na-montmorillonite, or commercial products, in particular “MX-80”. We therefore further restrict ourselves to look at chloride equilibrium in sodium dominated bentonite. We also require that the external solutions contain a specified concentration of a pure sodium salt (in practice NaCl, NaClO4, or NaNO3).
This figure summarizes basically all (as far as I’m aware) published data — subject to the requirements stated above — on equilibrium chloride content in compacted sodium bentonite (click on it for full size)
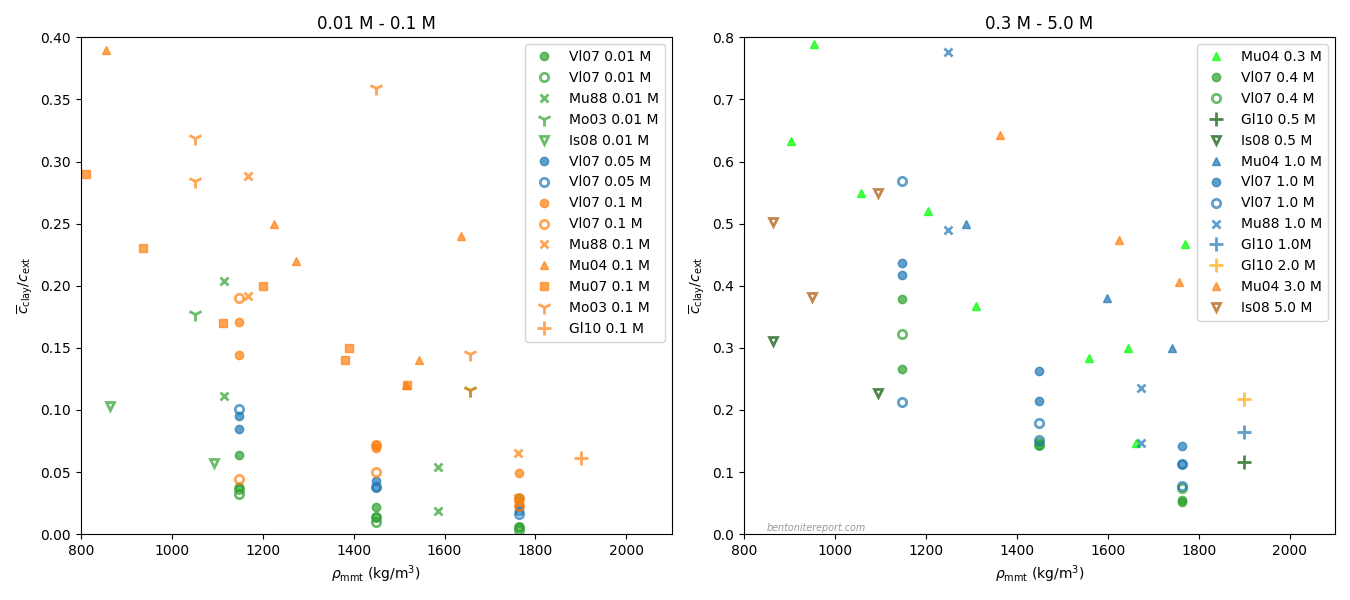
The plots show sets of equilibrium chloride concentrations as a function of density, for constant external concentration. The equilibrium concentration is expressed in terms of the “exclusion variable”
where
The left diagram shows measurements done with background concentration 0.1 M or lower, and the right diagram shows measurements with background concentration 0.3 M or higher. The data within each diagram is color coded: background concentration increases in the order green
We don’t have to examine the above plot in any great detail to conclude that existing “anion” exclusion data is quite heavily scattered. By squinting the eyes, and without assessing the reasonableness of individual data points, the graphs basically say that, for e.g. density ~1200 kg/m3, chloride exclusion is determined only within the range 0.05 — 0.3 at 0.1 M, and the range 0.2 — 0.8 at 1.0 M.4
The overall scattering is so large that it is doubtful if the data supports any of the models that has been suggested for anion exclusion in compacted bentonite. To my knowledge, any such model complies with the following “truths”
- Exclusion increases with increasing density at constant background concentration
- Exclusion decreases with increasing background concentration at constant density
Taking the above data at face value, it is probably fair to say that it supports the first of these statements. But although it complies with this qualitative statement, it is hard to see how a more quantitative description — i.e. an expression describing how chloride exclusion decreases with density — could be extracted from the data.
The second “truth” is not even qualitatively supported by the data. Although a relatively clear trend of decreasing exclusion with increasing background concentration can be spotted at low concentrations, the data points for higher concentrations are relatively well scrambled.
In my head it is quite clear that the problem here is the experimental data (viewed in aggregation), rather than the truth-values of the statements listed above. To better understand the source for the scatter, I therefore think each underlying study should be reviewed and assessed. Apart from reasonably being of varying quality, there are a number of factors that potentially could contribute to the noise, e.g. differences in sample materials (purified montmorillonite or “raw” bentontie), and test principles (actual equilibrium tests or through-diffusion tests).
In future blog posts I intend to perform these reviews of the involved studies. Faced with the plots above, I think this may be a more fruitful activity than to just switch to log axes and continue with modeling.
Footnotes
[1] There is also some systematic iodide data, which I may take a look at in a future blog post.
[2] This variable is known under many names, e.g. “montmorillonite density”, “partial dry density”, “effective clay dry density”, or “effective dry bulk density of the clay matrix”.
[3] I have assumed
[4] These are intervals for the actual measurements. An appropriate confidence interval is even larger than this.
Hi, Just wanted to say this blog has been really helpful for me as someone who isn’t deep into bentonite research to get a handle on what everything means and what pitfalls to avoid. It’s important (and thankless) work, and it’s really good there’s a record somewhere of crticial analysis of the contradictions and misunderstandings that seem to have snowballed together in the field. Godspeed
Thanks for the encouragement! I really appreciate it. /Martin
Pingback: Assessment of chloride equilibrium concentrations: Muurinen et al. (2004) | The Bentonite Report